Half of Dubai's restaurant Instagram is quiet. Not underperforming, not posting the wrong things. Quiet.
We know because we counted. Synthopia maps Dubai's F&B landscape venue by venue: 5,321 restaurants and cafes in our database, 421 with a matched Instagram account, 351 with enough posting history to measure. This is what those accounts were actually doing in July 2026. We publish this as the Synthopia F&B Index, and we will keep publishing it as the panel grows.
The headline numbers
The median tracked venue posts 0.7 times per week. The average is 1.85, more than double the median, because a small group of heavy posters pulls the mean up while most of the field barely posts at all. Posting in Dubai F&B is an inequality curve.
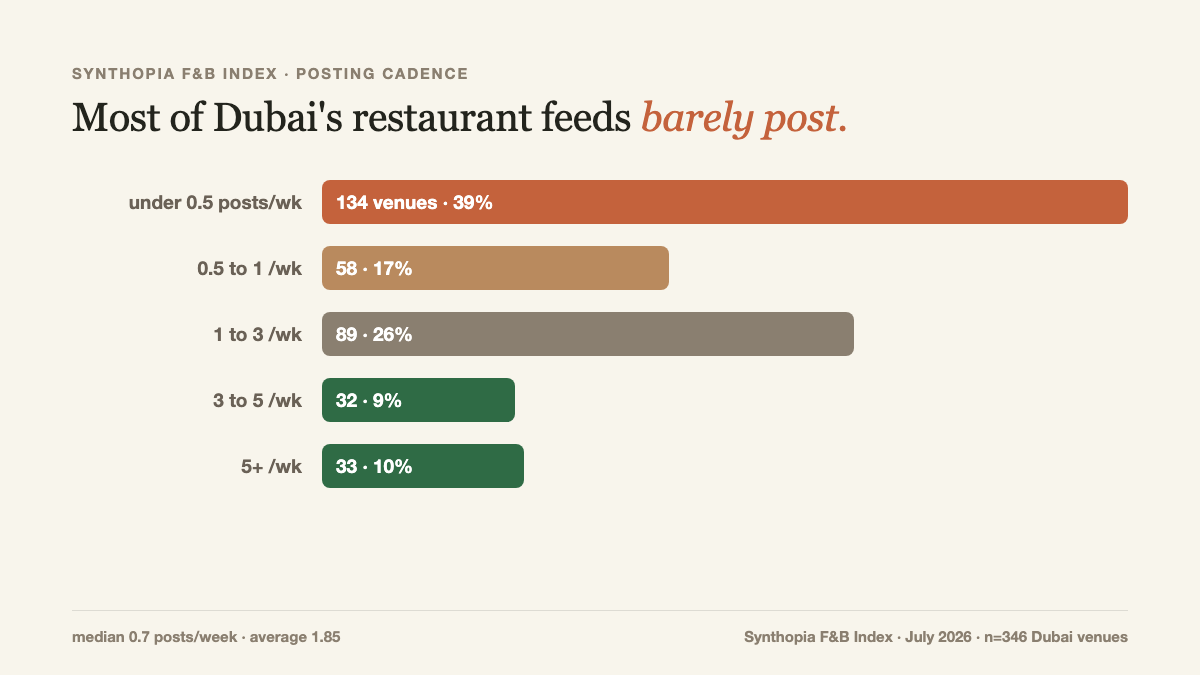
Of the 346 venues with cadence data, 134 (39%) post less than once a fortnight. Only 65 venues (19%) post three or more times a week, the range most platform guidance treats as the floor for meaningful reach. One global benchmark found accounts posting fewer than 4 reels a week saw around 23% lower overall reach, according to Digital Applied's 2026 data.
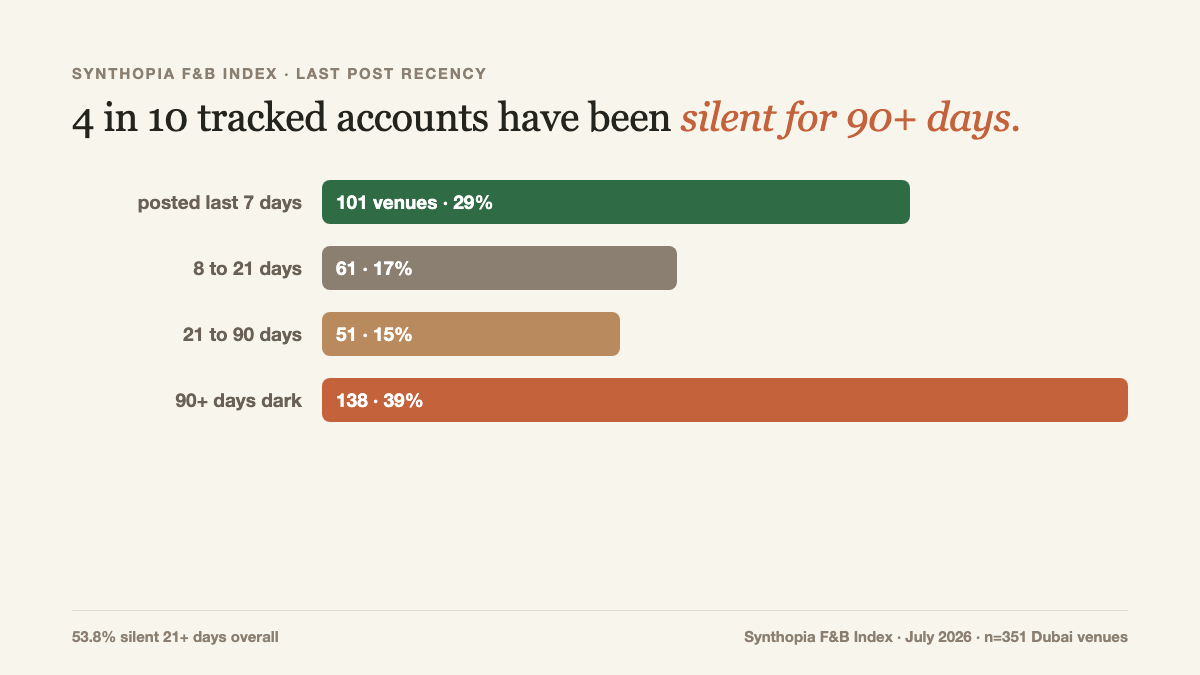
Recency tells the same story from another angle. As of this week, 53.8% of tracked accounts had not posted in 21 days or more. And 138 accounts, 39.3% of the panel, had been silent for over 90 days.
The part nobody expects: the silent venues are good
The lazy explanation is that quiet accounts belong to failing restaurants. The data disagrees.
Silent venues average a 4.18 Google rating. Active venues average 4.27. That gap is noise. Among venues rated 4.5 stars or higher, 44% are silent on Instagram. The median tracked venue has 373 Google reviews. These are established, well-reviewed businesses with real kitchens and real customers, invisible on the platform where those customers decide.
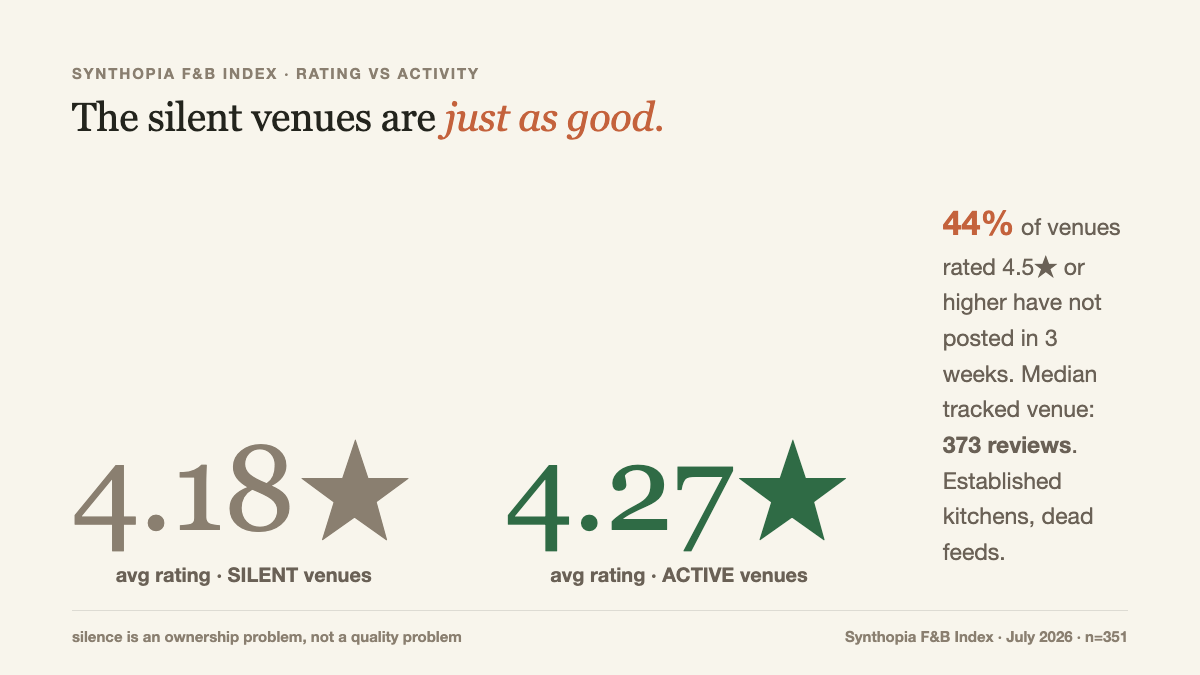
Silence in Dubai F&B is not a quality problem. It is an ownership problem. In most independent venues the owner is the marketing department, and the marketing department also runs service, staffing and suppliers. A May 2026 survey by Picmim found small business owners spend 6.3 hours a week on social media marketing, most of it unaided. The alternative is an agency retainer that runs AED 3,000 to 12,000 a month in the UAE, according to GoodFirms' 2026 pricing data. Faced with those two options, many operators quietly choose a third: nothing.
The aggregator trap
Of our tracked venues, 136 are live on Talabat, Deliveroo or Careem. 67 of them, just under half, are simultaneously silent on their own Instagram.
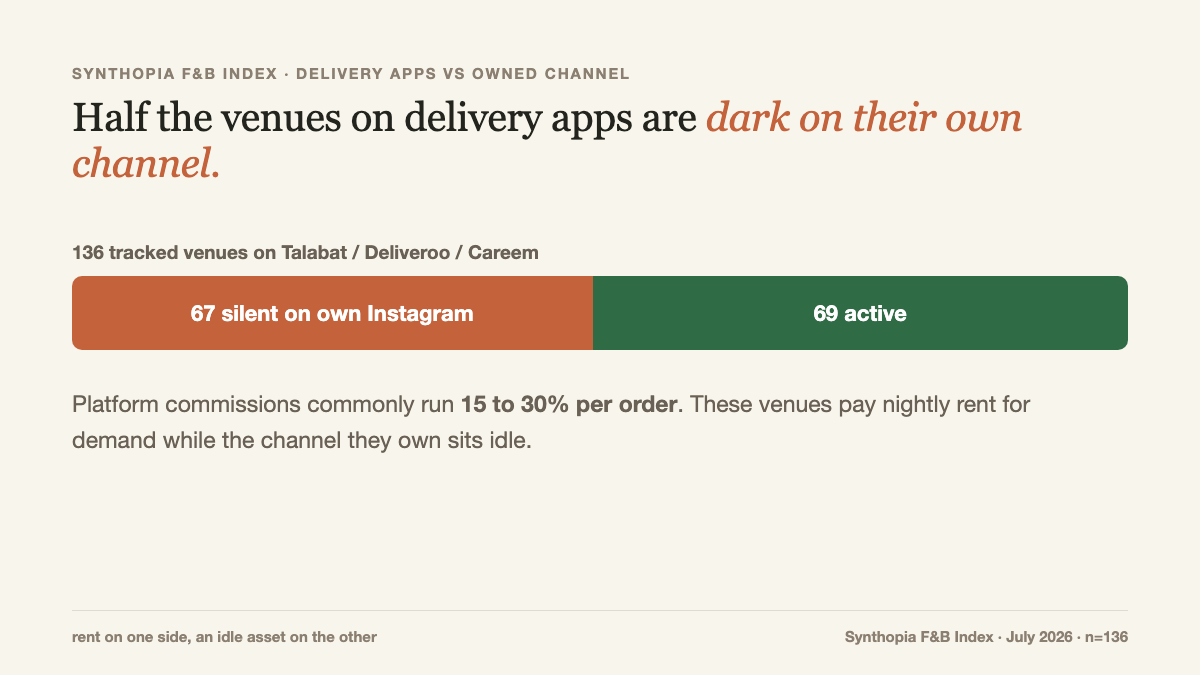
Think about what that combination means. Delivery platforms charge commissions that commonly run 15 to 30% per order. A venue in that position is paying to rent demand every single night while the one channel it owns outright, the one where 83% of UAE diners check before deciding where to eat according to SocialHype's 2026 report, sits dark. The rent is real and recurring. The owned channel costs nothing but consistency.